
Health, Place, And Covid-19 Vaccines: Why Geography Matters For Equity And Public Health Now, And Once Vaccines Are Widely Available
A novel place-based approach to COVID vaccine allocation could reduces inequities, even as states have adopted differing allocation frameworks.

Summary
There is a close link between health and place: People living in more disadvantaged neighborhoods have poorer health outcomes and reduced life expectancy. Unfortunately, COVID-19 reaffirmed this association with cruel clarity, surfacing deep societal inequities across income as well as racial and ethnic groups, particularly Indigenous, African-American and Hispanic groups who have suffered the highest rates of unemployment, infections, hospitalizations, and deaths. For vaccine allocation, this situation raises three possible outcomes, as allocations can maintain, increase, or decrease inequities. A novel place-based approach holds considerable potential to allocate vaccines in ways that reduces inequities, even as states have adopted differing allocation frameworks.
Disadvantage indices—statistical measures that integrate different variables to capture how vulnerable, on average, people living in a particular area are—offer a unique opportunity to simultaneously promote public health and social justice. In the context of vaccine distribution, these indices are being used by more than half of the US’ states for four concrete and vital purposes: planning vaccination locations; conducting targeted outreach to disadvantaged groups; allocating larger shares of the vaccine to those most in need; and monitoring allocation to ensure equity.
No matter how jurisdictions resolve still raging debates about how to structure the sequence of priority groups for vaccine eligibility, the increasing use of disadvantage indices underlines the real-world impact of the approach for meeting the demands of both public health and social justice.
Background
Around the U.S., there have been intense debates around the sequence of priority populations to receive COVID-19 vaccinations. Since vaccines were first shipped a few months ago, and as people have become increasingly impatient with the pandemic, these debates have intensified in both the media and across kitchen tables. A recurrent question for many has been, “When is it my turn?” Often, this question is coupled with a second one, along the lines of, “How come my cousin, who lives just across the state border and is exactly like me, will get a vaccine earlier, under her state’s priority sequences?”
While all states and other jurisdictions assign the highest priority to healthcare workers, they differ in how they sequence other populations, such as people with comorbidities, those with particular professional obligations, older populations, or people who are homeless, or incarcerated individuals. Part of the intensity of the debate rests on the fact that deciding who should be prioritized for the vaccine combines, simultaneously, public health and equity considerations (and, in public perception, is also often seen as expressing who is most deserving of receiving a vaccine). But it is important to understand that equity and public health are not only determined by the sequence across priority populations, but also by how vaccines are allocated within them.
The equity story doesn’t end with having established a particular framework for allocation across different groups. In many ways, it only starts there, and that’s certainly true once vaccine eligibility is extended to the general population (which, depending on what framework one uses, and what assumptions one makes about how many people who already qualified for vaccines still have not received one at that point, still accounts for 100-150 million people). Luckily, both the federal government and the majority of states have recognized this, and increasingly embrace the use of disadvantage indices. These indices can help ensure that within each of the phases of vaccine allocation, whatever sequence of priority groups a state or other jurisdiction might be using, harder hit populations—for whom a vaccine matters more on economic, public health, and ethical grounds—are offered a vaccine in convenient and trusted settings before other groups for whom it is comparatively easier and safer to wait a little longer. Thus, while decision-making on priority groups and the application of these indices within groups are distinct considerations, the indices help directly with accomplishing a more equitable allocation of the vaccines, no matter what the prioritization sequence may be.
What are disadvantage indices
Defining what it means to be disadvantaged is inherently imprecise. Yet, just as we are unable to pinpoint to an exact moment when night ends and day begins, or to explain to our kids what exactly it means to treat someone fairly, or kindly, we all operate routinely and successfully with such concepts that have fuzzy boundaries. Disadvantage indices fall into the same category, and should be seen as pragmatic, rather than perfect tools.
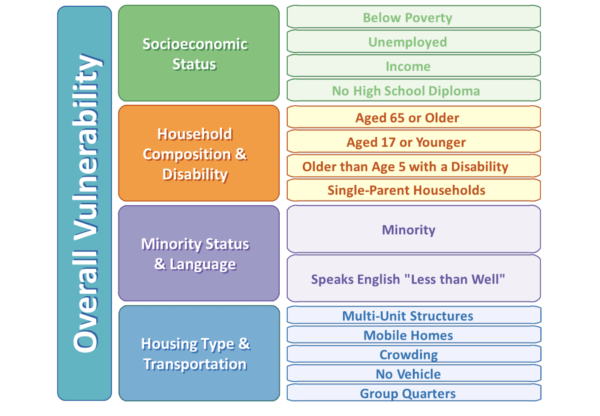
The most widely used index for improving equity in vaccine allocation is the Centers for Disease Control and Prevention’s (CDC’s) Social Vulnerability Index (SVI). The SVI was developed in 2011 by the CDC not for vaccine allocation, but for disaster management: to identify communities that need support before, during, and after public health emergencies, such as hurricanes, floods, or earthquakes.
The SVI uses U.S. Census data, and ranks each county and census tract on 15 factors that capture different types of vulnerability, grouped under four related themes as shown in Figure 1:
Figure 1: The CDC Social Vulnerability index
As colleagues and I determined in a recent review, the majority of states (29) now uses a disadvantage index for vaccine allocation, and SVI is used by at least 23 states. There are several other related indices as well. For example, the Community Vulnerability Index is based on the SVI and integrates further COVID-19 specific variables (it’s used by three states). The Area Deprivation Index, an established metric in academic and policy research that has been developed specifically to inform health delivery and policy, integrates 17 variables from the American Community Survey that are grouped under the domains of income, education, employment, and housing quality, and is focused on the lowest geographical unit of the neighborhood, or block-group level (it’s used by 2 states). Two states and one city also developed their own index, and some use several different indices, for different purposes.
What all indices have in common is that they generate a numeric score that enables one to rank geographic areas by their relative level of disadvantage (however the concept is constructed under the index). There are two principal uses of these indices for addressing the COVID-19 pandemic: the first descriptive, the second relating to actual allocation.
The explanatory power of using disadvantage indices for COVID-19
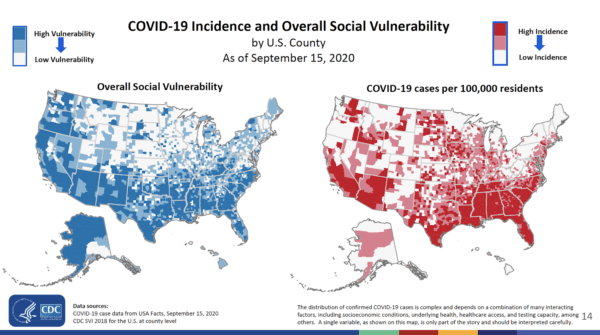
Figure 2 shows two maps from a study led by CDC researchers. The blue map on the left shows counties by their level of vulnerability, using the SVI. The darker the shading, the higher the level of disadvantage. On the right, in red, we see COVID-19 cases per 100,000 residents: again, the darker the shading, the more people are infected. Without much squinting, it is apparent that there is an association between the counties with more disadvantaged people and those with more cases.
Figure 2: SVI and COVID-19 cases
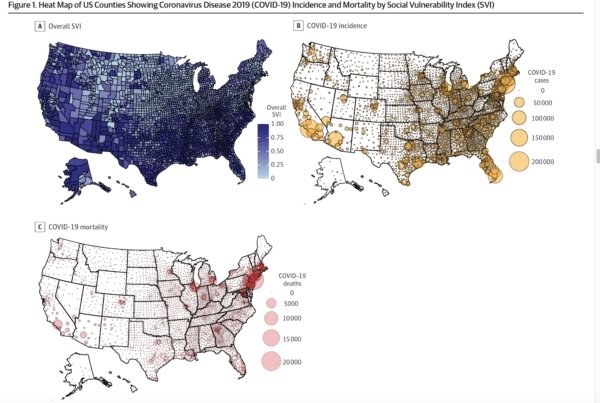
A more recent study, using the same index and also describing COVID-19 deaths, reaffirms this association. In Figure 3, the top left corner shows counties by disadvantage, the top right shows incidence, and at the bottom are deaths. The researchers note that at the county-level “sociodemographic risk factors were associated with greater COVID-19 incidence and mortality.” Also, an “increase of 0.1 point in SVI score was associated with a 14.3% increase in incidence rate (incidence rate ratio [IRR], 1.14; 95% CI, 1.13-1.16; P < .001) and 13.7% increase in mortality rate (IRR, 1.14; 95% CI, 1.12-1.16; P < .001).” Therefore, the more disadvantaged you are, the more likely you are to contract, spread, and die from COVID-19. Whether one views these maps as capturing an epidemiological relationship, or as also expressing a concerning social justice dimension, changes nothing about the robustness of the association.
Figure 3: SVI, COVID-19 cases, and COVID-19 deaths
How disadvantage indices can be used in vaccine allocation
To see how indices can be used for improving the equity of allocation, it is helpful to come back to a schematic illustration in a landmark report of the National Academies of Sciences, Engineering, and Medicine (NASEM) who were asked to provide a framework on equitable vaccine allocation that would inform the federal governments’s guidance to states. . NASEM set out a risk-based phased framework that embedded equity considerations in its sequence of priority populations and, importantly, also recommended that equity be implemented as a cross-cutting consideration, expanding a prior academic proposal to embed a disadvantage index in allocation.
Figure 4: Equity as a cross-cutting consideration in phased allocation–The National Academies of Sciences, Engineering, and Medicine framework
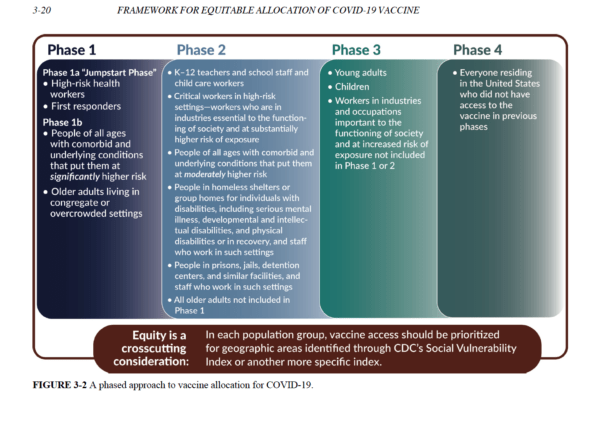
NASEM notes that measures such as the SVI incorporate “the variables that the committee believes are most linked to the disproportionate impact of COVID-19 on people of color and other vulnerable populations.” To translate this recognition into practice, the committee recommended setting aside 10 percent of federally-available vaccines at any given point of distribution to add to the allocations that disadvantaged groups would have been offered based on population alone. Further, states and other administrative units should “ensure that special efforts are made to deliver vaccine to residents of high-vulnerability areas (defined as the 25 percent highest in the state).”4
More recently, in light of disproportionately lower vaccine uptake by communities of color during the first month of roll-out, the CDC recommended that “monitoring coverage by [SVI] will be useful to ensure equity and to identify communities where focused immunization efforts might be required.” This echoed an important recommendation in the National COVID-19 Strategy that states should “update their pandemic plans to describe how they have or will provide equitable access . . . using [SVI] or other indices,” with another recent CDC-led study underlining both the need and feasibility of using SVI in this way.
The four current main uses of disadvantage indices to promote equitable allocation
While the emphasis on using SVI or similar indices at the federal level has not been amplified further by the Advisory Committee on Immunization Practices’ (ACIP) guidance, that is traditionally offered to states, it dovetails neatly with an important groundswell of activity by the CDC’s 64 immunization grantees, commonly referred to as “jurisdictions” (the 50 states, the District of Columbia, five large cities, and eight territories, that, for historic reasons, are the administrative units to which vaccines are shipped; each develop its own allocation frameworks). In this next section, I summarize four main purposes for which jurisdictions use disadvantage indices: planning dispensing sites; targeted outreach and communication strategies; offering larger shares of vaccines to more disadvantaged groups; and monitoring (including, if necessary, course-correcting) allocations. This summary is based on an updated review colleagues and I recently completed of jurisdictions’ allocation frameworks (for further detail on how many jurisdictions are using indices in what way—including a breakdown by politics, which suggests use or non-use of a disadvantage index is non-partisan—see here).
The first use is for ensuring that, within each phase, more disadvantaged people are able to find vaccines at locations in areas in which they live, whether these are hospitals, federally-qualified health centers, pharmacies, or non-traditional sites such as schools, sports centers, or mobile units. Location matters, as the experience of testing for COVID-19 already illustrated that it is harder for more disadvantaged groups to spend several hours waiting in line, due to less flexible working hours, more caring obligations for family members, or transportation challenges.
Secondly, while a convenient location is generally a necessary condition to enable more disadvantaged communities to take up vaccines, it is frequently not a sufficient one. Many states therefore additionally use indices to devise outreach and communication strategies, often in partnership with community groups in disadvantaged areas. Easily reachable dispensing sites are of limited use if people are not aware of them, or don’t trust vaccines or the healthcare community, which is often an entirely understandable response in light of patterns of unfair treatment in interactions with healthcare providers and government services. Working proactively with community groups can help match supply with uptake among communities in greater need, and be a step toward re-establishing trust and engagement over the long term.
Third, to reduce scarcity for more disadvantaged groups more quickly than for more privileged ones, 13 states offered larger shares of vaccines to harder-hit areas, identified using a disadvantage index. While the exact magnitude of increased allocations relative to what communities would have received based on population alone is not always clear, four states offer between five and 20 percent additional vaccines, and California recently announced that it would allocate 40 percent more to disadvantaged communities. These measures can also help reduce the impact of better-off and well-connected groups who work the system to their advantage.
Fourth, amid the variation across jurisdictions, disadvantage indices can offer a central benchmark such that whatever sequence of priority groups has been adopted, within each phase, planners can monitor and course-correct uptake across the disadvantage index spectrum. A reasonable target in this regard would be to aim, at a minimum, for no differences in vaccinations across the disadvantage index spectrum. As such, while we will likely remain in choppy waters for months to come, an index can still function as a compass to enable an equity-promoting course each time a new batch of vaccines is allocated.
Finally, disadvantage indices enable a practical yet meaningful vehicle for navigating the intersection of racial and social justice. The key demand of justice is that allocation responds adequately to the reasons underlying the disproportionately higher incidence and mortality among communities of color.. This impact is due not to genetics, but to the fact that communities of color are more prevalent among the nation’s disadvantaged people, as society is structured in ways that curtail their economic mobility and odds of leading long and healthy lives. An index that captures a generalized concept of disadvantage, but is not strictly limited to race, helps to directly meet the needs of, particularly, more disadvantaged Indigenous, Hispanic and African-American populations who have been hit much harder by Covid-19, while recognizing that disadvantage can take many different forms that matter independently.
Conclusion
As difficult as it can be with the myriad vaccine distribution decisions that we still face, and as confusing as the differences in vaccine priority groups across state and city borders can be, amid the flux, using disadvantage indices promote public health and social justice simultaneously, and provides a steady guiding light for allocating in ways that reduce, rather than maintain (or worse: increase) inequities in the vaccine roll-out.
Aside from the urgency of equity in the here and now, it should also be kept in mind that COVID-19 is not just a generation-defining event, but in all likelihood will have an impact lasting beyond just a single generation. So when we look back at how, ultimately, we responded as a society (whether this is in a decade, two, or later) there seem to be two possible outcomes.
We may find that despite efforts to promote equity, in the end we failed. Or we may have begun what was long overdue, and that is to make real and measurable progress in health equity and economic mobility. And that is the unique opportunity that disadvantage indices offer right now.